A developer stands at the front of a community hall in a country town. Beside them is a foam board displaying a photomontage, a single image with wind turbines superimposed onto the landscape.
A farmer at the back raises his hand and asks the only question he really cares about:
“What will it look like from my back verandah?”
Nobody in the room can give him a clear answer.
That single unanswered question has delayed more wind projects than most technical challenges ever will. Yet it keeps surfacing because traditional visualisation tools simply aren’t designed to answer it.
Augmented reality in wind farm planning changes that in seconds.
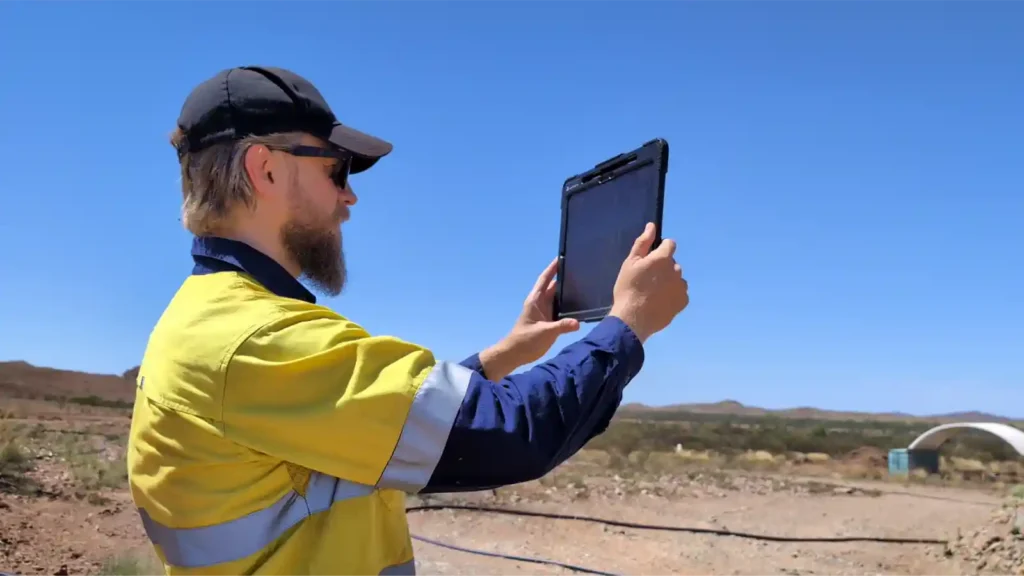
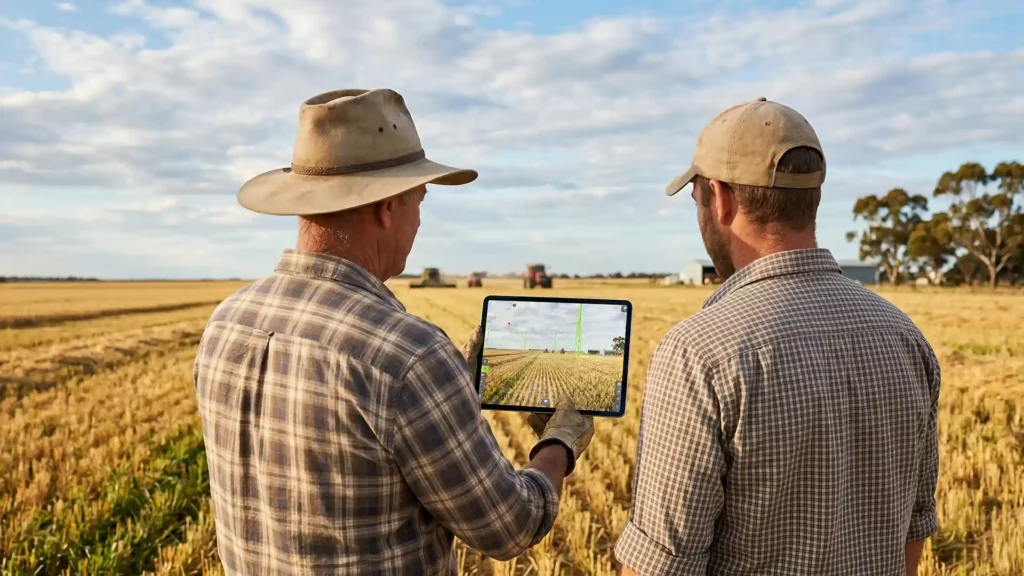
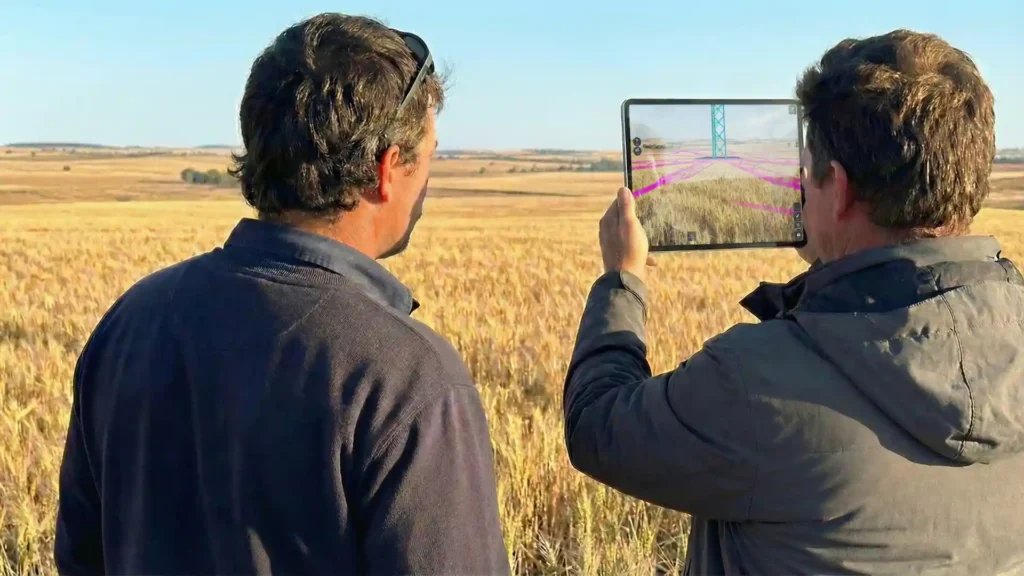
Instead of asking people to interpret a flat image, you can hand them a tablet. They point it at their own property, and the proposed turbine appears at full scale in its exact planned location, with the blades turning in real time. This is so interactive that they can walk a few metres to the left, move closer, look up from a different angle, and see the project from their own perspective.
Most importantly, they don’t have to imagine the impact. They can see it for themselves.
That’s the real shift.
Augmented reality turns an abstract planning discussion into something tangible and easy to understand. And that’s exactly why forward-thinking developers are already using it to improve community engagement, address concerns earlier, and build trust throughout the planning process.
Let’s see how it works and why more wind farm developers are making this move.
What is Augmented Reality in Wind Farm Planning?

Wind farm planning is not simply about finding a location with suitable wind resources. The design has to respond to the surrounding landscape, existing infrastructure, assess environmental constraints and the way the development will be experienced from nearby locations.
Visual impact is an important part of that process. Western Australian planning guidance considers factors including turbine height, rotor size, number of turbines, layout, access roads, transmission infrastructure, vegetation and the surrounding landscape when assessing the visual effects of wind farm developments.
That means a change to the position or configuration of a turbine can affect more than the engineering plan. It can change what people see. This is where wind farm visualisation becomes valuable.
Photomontages can show what a proposed project may look like from selected viewpoints. Wireframes can illustrate the relationship between turbines and the surrounding terrain. Digital 3D models can provide a more detailed representation of the project.
But each method still presents the project through a predetermined view.
AR introduces another possibility: let people move through the real environment and see the proposed development in context.
The Problem AR Solves
Most teams still plan with 2D maps and then commission photomontages late in the process. Those montages take real effort and real money, and they still cannot cover every factor that matters.
Europe’s energy sector said this out loud years ago. When German utility EnBW launched its own AR planning app, it explained that developers had been working from elaborate 2D maps, then producing photomontages at considerable effort that could not account for many factors. It also made a point that anyone who has run a consultation session will recognise. The sheer size of modern turbines sometimes exceeds what people can picture in their heads.
That is not a communication failure. That is a human limit.
Australian projects now propose turbines reaching 275 metres to blade tip. Ask someone to imagine 275 metres from a printed A3 page and you are asking too much. When people cannot picture something, they assume the worst. Researchers who tested immersive turbine visualisations found exactly that pattern, and found that showing people a realistic experience corrected mistaken beliefs about visual and noise impact, with the biggest shift among people who knew least about wind energy to begin with.
So, the objection you are fighting is often not opposition to your project. It is a gap in the picture.
What AR shows that a photomontage cannot

A photomontage gives people a single viewpoint, captured at a single moment under a specific set of conditions. AR gives them a much more complete picture.
Here is what a properly built system displays:
- Rotating blades. Motion changes how people read scale. Still images hide it.
- Nacelle direction. Turbines turn to face the wind. Your visualisation should too.
- Cast shadows and sun position by time of day. This is how you have a real conversation about shadow flicker instead of an argument about it.
- Any viewpoint the viewer chooses. Not the three viewpoints you selected.
- True scale at true distance. Walk closer, it grows. Walk away, it shrinks.
None of this is experimental technology. Utilities and developers around the world have been using geographically accurate, animated turbine visualisations for years, and it’s exactly what we built GEAAR to deliver for Australian projects.
Research into wind farm visualisation has highlighted one of AR’s biggest advantages: the ability to view a proposed development from multiple angles and locations. That’s something a fixed photomontage can never provide, no matter how well it’s produced.
Five Ways AR Improves Your Project
1. It Settles the Scale Debate on Site
Stand in the paddock, hold up a phone, and see the turbine exactly where it’s planned to sit.
No guesswork. No debating whether a render is accurate. People can assess the project from their own property and make up their own minds.

2. It Speeds up Wind Farm Layout Planning
Good wind farm layout planning is all about balancing yield, setbacks, access tracks, vegetation, and visual impact.
Move a turbine 200 metres and see the change immediately, from the viewpoint that matters. Test two layouts in an afternoon instead of waiting a fortnight for new montages. That speed changes how many options you can afford to explore, which usually produces a better final layout.
This is not a hypothetical margin either. Australian wind proposals routinely build in a micro-siting allowance so turbine positions can shift during detailed design. Marri Wind Farm, for example, allows a 300 metre radius around each turbine, provided the setback from the site boundary still holds. Every one of those positions changes what somebody sees from their kitchen window. AR lets you check that before you commit.
3. It Turns Consultation into a Conversation
Traditional consultation puts developers in front of a room explaining a proposal. AR puts the community in control.
People can explore the project from the viewpoints that matter to them, creating more informed discussions and building trust along the way.

4. It Strengthens Approvals
AR doesn’t replace a formal assessment, but it helps identify issues much earlier.
By testing layouts during wind turbine site planning, teams can spot problem viewpoints before they become objections, reducing redesigns, delays, and surprises later in the approval process.
5. It Keeps Delivering Value After Approval
The value doesn’t stop once the project is approved.
The same model can support construction planning, inspections, maintenance, and workforce training. One geospatial asset can serve multiple teams throughout the project’s lifecycle.
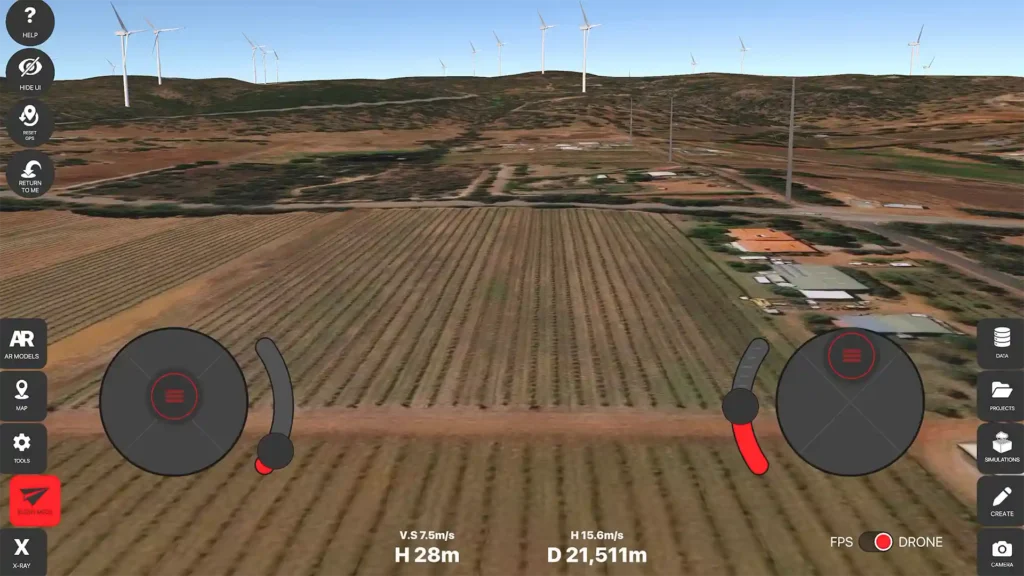
One Model. Better Decisions. Value that Extends Far Beyond Planning.
What This Means for Australian Renewable Energy Projects
Australia’s renewable energy pipeline spans vast areas, often in remote locations where communities want a clear understanding of what a project will look like before it’s built.
Planning frameworks already recognise the importance of visual impact assessments, including factors such as turbine location, layout, and visibility from public viewpoints. Traditionally, developers have relied on wireframes and photomontages to communicate those impacts.
We’ve worked within this environment ourselves. Our portfolio includes work on Fortescue’s East Pilbara Generation Hub, a large-scale wind farm project that required visualisation across remote Pilbara locations. Using drone-captured footage, we integrated proposed infrastructure, including turbines, roads, and footings, to help stakeholders understand how the development would sit within the landscape.
That experience reinforced an important lesson: renewable energy visualisation isn’t just about creating impressive imagery. It’s about helping people understand how infrastructure will fit into the places where they live, work, and visit.

GEAAR and the Future of Project Communication
That’s where GEAAR (Geospatial Everywhere Anywhere AR) comes in.
We developed GEAAR to place digital project models into real-world locations, allowing people to explore infrastructure from different perspectives and interact with project information in ways traditional plans and drawings can’t provide.
For wind energy projects, that means viewing turbines, access roads, substations, and other infrastructure at their proposed locations and at true scale.
Instead of asking people to interpret a plan, you let them experience the project in context.
And the opportunity extends well beyond visualisation. As AR becomes more closely connected with GIS, digital twins, engineering models, and real-time data, it has the potential to become a powerful tool for understanding not just where infrastructure will be, but how design decisions affect the surrounding environment.
That’s a far more valuable outcome than simply placing a 3D turbine on a phone screen.
The Future of Wind Farm Planning is Becoming More Spatial
The biggest challenge in wind farm planning isn’t a lack of data. We already have plenty of it.
In Australia, developers can access incredibly detailed datasets. Geoscience Australia, for example, provides national elevation data, including LiDAR-derived models with resolutions down to one metre. Add survey data, environmental assessments, and wind resource modelling, and the technical picture is often already there.
The real challenge is helping people understand what all that data means.
Maps tell us where something will be. 3D models show us what it might look like. Photomontages offer a glimpse from a few carefully selected viewpoints. AR brings all of that information back into the real world, allowing people to see the project in the landscape around them.
And that’s important because not everyone interprets plans the same way.
Researchers in spatial planning have highlighted a common problem: people without specialist knowledge or strong spatial awareness often struggle to understand 2D drawings and technical plans, no matter how accurate those plans are.
That challenge is only going to become more significant as Australia’s renewable energy rollout accelerates.
According to AEMO’s 2026 Integrated System Plan, grid-scale wind and solar capacity is expected to grow from around 23 GW today to approximately 117 GW by 2050. Every one of those projects will need to engage with communities, landholders, regulators, and stakeholders. Every one of them will involve conversations about visual impact, landscape change, and what the proposed development might look like.
And somewhere along the way, there will probably be another community meeting and another landholder asking:
What will it look like from my place?
That’s where augmented reality in renewable energy becomes more than a visualisation tool.